Amazon Holds Up the Tape as Leveraged Money Bets on a Rebound

US Stocks · Options · News · Views
US market recap — October 19, 2026
The indexes bounced, but the market did not move as one
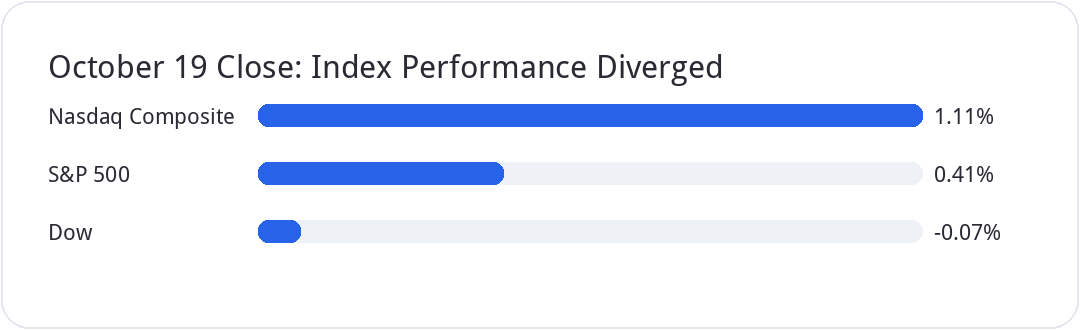
US stocks finished mixed on Monday. The Nasdaq Composite gained 1.11%, the S&P 500 rose 0.41%, while the Dow slipped 0.07%. Technology shares helped lift the headline indexes, but most S&P 500 constituents still declined. A stronger index close did not mean broad participation had returned.
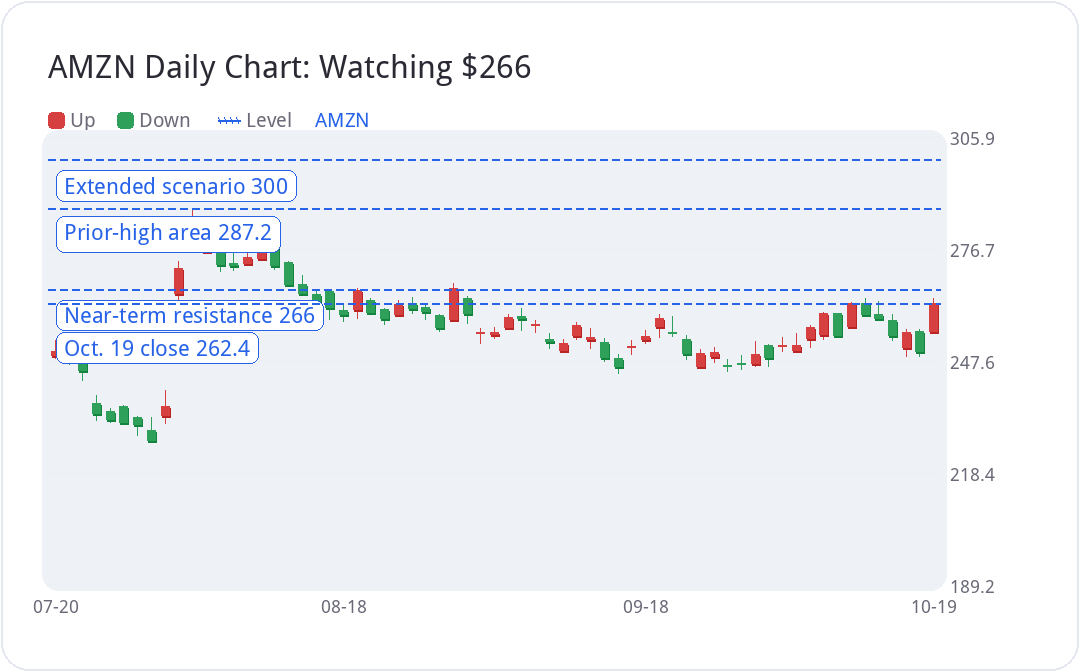
Amazon (AMZN) rose 4.98% to $262.45, providing an important lift. Morgan Stanley named Amazon a top pick and raised its price target from $335 to $350. That helps explain the stock's strength, but an analyst target is an estimate, not a promise that the shares will reach it.
Record inflows into leveraged ETFs cut both ways
Goldman Sachs weekly flow data cited in the market commentary showed about $9.5 billion flowing into leveraged ETFs during the week of October 12–16. The largest recipients were SOXL, the 3x leveraged semiconductor ETF, at roughly $7 billion, and TQQQ, the 3x Nasdaq-100 ETF, at about $1.3 billion. Independent market reporting also described SOXL's weekly inflow as a record, following a sharp sell-off in semiconductor shares.
After a drawdown, money pouring into leveraged long products can fuel a rebound. It does not prove that a bottom is in. Some buyers may be positioning for a bounce; some institutional activity may reflect short covering. Flow data alone cannot tell us who bought or why.
The next test is breadth. If a handful of mega-cap technology names keep the indexes afloat while most stocks lag, the rally may remain fragile. If selling pressure eases and more constituents participate, short covering could become part of a more durable move.
Lower net exposure does not necessarily mean lower total risk
The positioning figures cited in the commentary show US fundamental long/short funds' net leverage falling 3.2 percentage points to 43.7%, while gross leverage remained near 213.9%, around the 83rd percentile of its three-year range. These figures are attributed to the charts discussed in the market commentary and were not independently verified against a public primary source in this review.
That combination leaves two plausible paths. If long positions are forced to unwind and gross exposure falls, downside pressure could intensify. If fundamentals hold up and buyers return while short positioning remains elevated, a rebound could trigger further covering. The available figures alone do not settle which scenario will win.
CRWV illustrates the financing risk around AI infrastructure. The stock closed near $61.12 and did not join the broader technology rebound. Goldman Sachs upgraded it to Buy but cut its price target from $139 to $106. Reuters reported that the yield on its 2031 bonds had topped 16% the previous week and eased to around 15.13% on Monday. Strong demand for a business and expensive financing can coexist.
Earnings and lockups put volatility in focus
SPCX was expected to report third-quarter results after the close on October 20. At the time of the market commentary, the options market implied a move of roughly $11 either way around a share price near $148. Another public estimate put the implied move around 7.5%. These are snapshots derived from option prices, not price targets or directional forecasts.
Supply is another variable. A third-party lockup calendar flags potential releases on October 22 and October 26. The calendar is not a guarantee of how many shares will actually be sold, so the latest formal disclosures should be checked before treating those dates or percentages as definitive.
TSLA and META were expected to report on October 21. The options snapshots cited at the time suggested ranges of roughly $24 around $370 for Tesla and $49 around $705 for Meta. Such estimates change with share prices and option premiums; they describe priced-in movement, not the direction of the move.
For Meta, investors will also be watching capital-spending guidance. A substantial increase in planned AI investment for 2027 could prompt questions about whether cash flow and returns will keep pace with spending.
QQQ's $687 level is a risk marker, not a buy signal
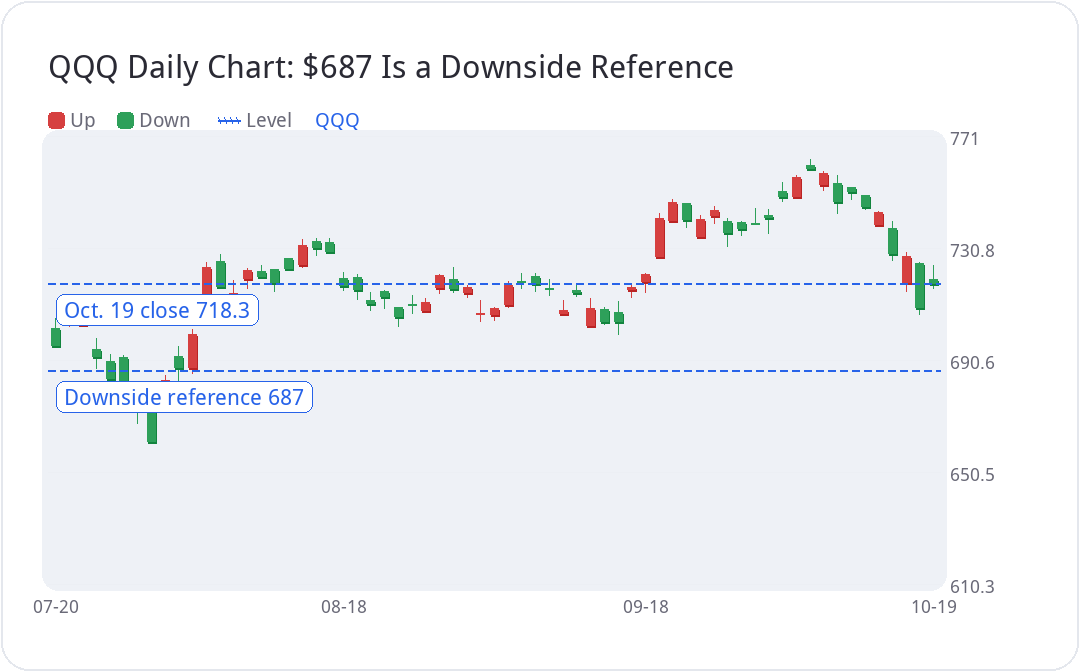
QQQ closed at $718.31 on October 19. The technical framework uses $687 as an important downside reference. A confirmed break below that level followed by a failure to reclaim it would weaken the rebound scenario. An intraday dip and a confirmed closing break are not the same thing.
For AMZN, the first test is the area around $266. A sustained break above it would put the prior-high area near $287 in view, with $300 a more extended scenario that would require fresh buying and fundamental support. A single strong session is not enough to establish a new trend.
Three signals matter this week: whether the rally broadens beyond a few large technology stocks; whether total market exposure actually declines after the rush into leveraged ETFs; and whether earnings provide evidence that AI spending is turning into profits and cash flow. Seasonal buybacks may add demand in November, but company-specific trading windows and execution plans vary.
The practical takeaway is conditional: if QQQ holds $687 and market breadth improves, the rebound has a stronger foundation. If that level breaks and cannot be reclaimed, record inflows into leveraged ETFs are not a reason to rush into a dip-buying trade.
For information only, not investment advice. Figures and options-implied moves are time-sensitive; check current prices and filings before making decisions.