The Buyback Holds Nvidia, but the Nasdaq Future Is Crowded

US Stocks · Options · News · Views
Nasdaq led the drop, and the ten-year closed at 5.24%
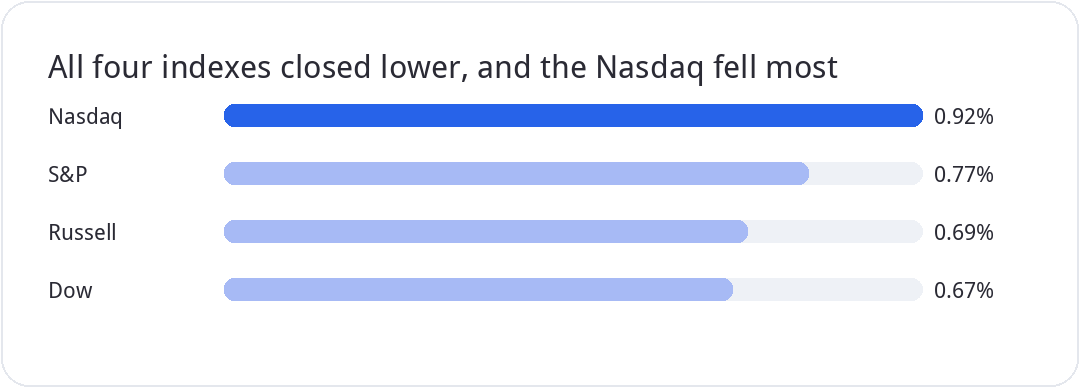
All four major indexes closed lower on Monday, and the Nasdaq fell the most. The S&P 500 finished at 7,683.69, down 0.77%. The Nasdaq Composite finished at 26,820.38, down 0.92%. The Dow lost 0.67%, and the Russell 2000 lost 0.69%. The Philadelphia semiconductor group was worse: 21 names closed lower, most of the gainers were up only a few tenths of a percent, and ASML rose a little more than 1%. Inside semis, the stock that actually led was NVDA, on the buyback.
Only three of the S&P 500's 11 sectors closed higher: consumer staples, health care, and energy. The 10-year Treasury yield closed at 5.24%, back through the recent high. Governor Cook's tone was hawkish. Inflation pressure is still expected to last for the next few months, while she said the labor market is prepared for rate hikes. Rate markets are pricing roughly a 70% chance of an October hike, at least three hikes over the next 12 months, and a small chance of a fourth. Some of that is early pricing. Some of it is speculative positioning.
Speculative longs piled into Nasdaq futures only
Speculators have lifted the net long in Nasdaq futures to the highest level in nearly ten years. The COT report shows the position flipped, over recent weeks, from a net short to the largest net long since 2017. The print is as of last Tuesday, so it lags. A book that size does not come out in one session.
Dow futures net longs were reduced. In S&P mini futures and Russell 2000 futures, speculators were covering shorts, not adding a large new long. The enthusiasm did not spread to the other index futures. Only the Nasdaq futures book was pushed to a near-ten-year extreme.
Bond shorts are full, and utilities are pressed to an extreme
The 10-year yield and the bond price move in opposite directions. In Goldman's CTA bond model, the short in the US 10-year is about 99% of the CTA's maximum short. It is effectively full. There is little room to add. Goldman's broader positioning gauge also shows duration badly underweight. Historically, that setup has tended to come before a lower 10-year yield over the following three months.
CTAs are systematic. They are not making a discretionary call. If the yield turns down, a rising bond price can trigger systematic buying and short covering, and the flow can extend the move. That is positioning, not a better fundamental story. How long it lasts, how far it runs, and which day it starts are not knowable from here.
Utilities are the second leg. Last week they were the most shorted sector in the US, and the short was the largest in nearly six years. JPMorgan's prime-brokerage data lines up: hedge-fund net exposure to utilities is the lowest since 2018, about 2.5 standard deviations below a normal book.
The short in utilities and REITs is not the same mechanism as a higher discount rate on growth stocks. These businesses are leveraged and asset-heavy. Higher yields tighten the debt constraint, slow expansion, and make EPS harder to grow. When yields spike, their earnings pressure is its own line.
A light long book plus a large short creates the conditions for a squeeze. If yields reverse sharply lower, utilities can be the first equity group to get squeezed. Stock-level gross positioning versus history is not visible here, so this is potential, not a promise.
The test is specific. If the 10-year falls back below 5% and utilities are still falling, the short is not large enough to squeeze, and that branch is dead. Only the bond leg remains. If yields fall and utilities rally hard, even outrunning the tape, that is a flow reversal, not a fundamental turn. Treat it as a one-to-three-month trade, not a three-year hold.
A sharp drop in the 10-year that comes from a bond short squeeze would also be a tailwind for equities and for growth. The difference is speed. Nobody can date the start or the duration. The flow changes every day.
Nvidia: a $235 billion authorization, and a neutral chart
NVDA's board added $150 billion to the repurchase authorization, taking the remaining authorization to $235 billion. The company called it the largest share-repurchase authorization increase on record and said it expects to execute the remaining program through fiscal 2028. Set next to Apple's earlier $110 billion authorization increase, this one is larger.
The earnings and the outlook were not the problem. The stock has been grinding because the float is huge. Buying back stock is a return of capital, not a new story. Even if the whole $235 billion were completed over one to two years, the rough lift to annual EPS is about 5%. That is an estimate, not company guidance, and it is not large.
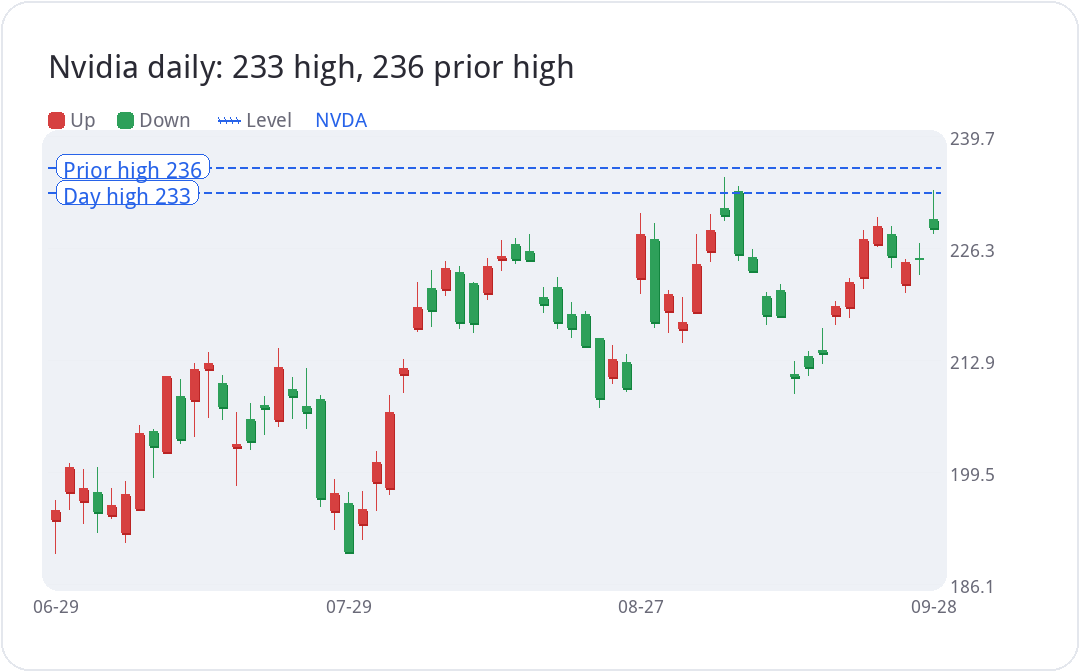
The chart is still a new-high structure. The prior high is 236. Monday's high was 233, eight dollars short. The candle alone looks like a stall. It was a gap up, though, and the close sat near the recent high, so it is a weak topping signal. The stance is to hold and keep watching. Treat it as neutral, not as a high-conviction short.
AMD is expensive for this moment, and 599.24 is the line
On a roughly 40x multiple of the high-growth forward numbers, AMD's 2027 forward ceiling is 556. After the systematic run, the price is above 600. That "expensive" call is about late September 2026. It is not a claim that the stock is still expensive at the end of 2027, once the market is trading a 2028 forward number.
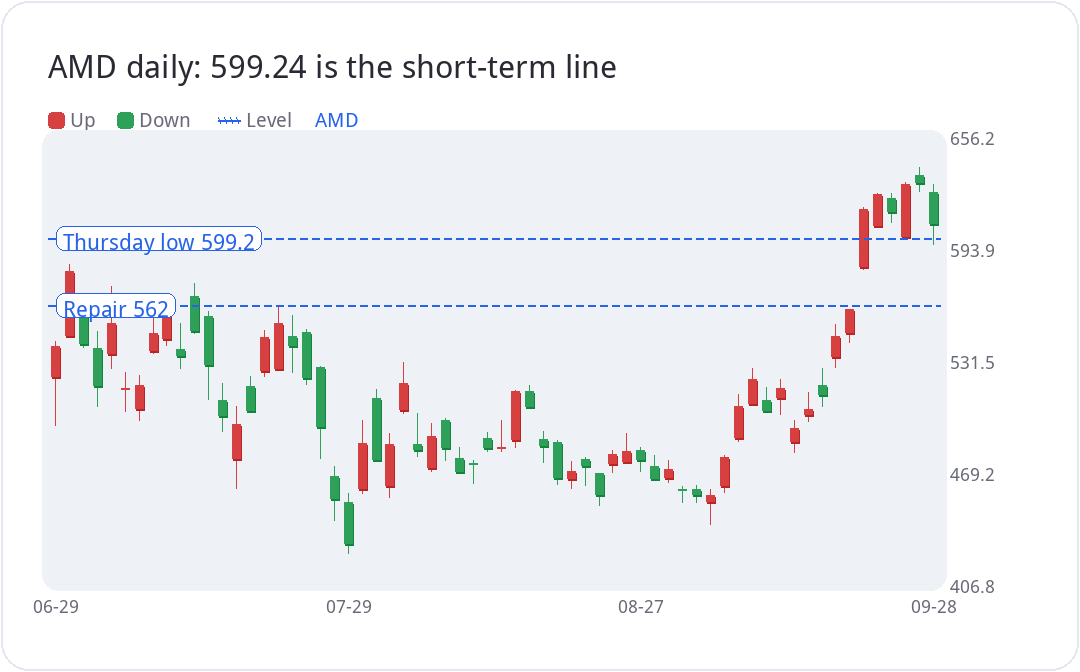
The short-term chart is not a standard stall. On the close, it is not a top, and the three-day combination is not one either. Friday printed a daily bearish divergence. Monday's drop did not finish repairing it.
If a later close or open falls below last Thursday's low at 599.24, this swing becomes a standard top, and the repair zone is below 562. If it does not close under 599.24, the view stays neutral. The technicals are not broken, and another push higher is still possible.
Microsoft stays put; Meta and Tesla are about whether the drop stops
MSFT is holding above the breakout. The Nasdaq's decline did not knock it back through that level. It opened on a low and buyers took it back up. This is still a hold after a breakout to new highs. Leave it alone.
META printed a fairly standard stall on Friday. That was a place to take the swing profit or to keep the long-term position. Monday's close is already under 730 and above 690. Selling here is a poor trade. The pullback was completed in one session, and both the divergence and the overbought reading have been repaired. The question now is whether 690 to 730 can stabilize.
TSLA reached 386 and never tagged 415, the top of the range, before it fell almost 4% and closed under 368. The first support is above 331. If 331 does not hold, 315 has to be defended. A break of 315 wrecks the range overhead. The box is still 315 to 465, about 150 dollars wide, and it has not changed for a long time. A push either way can still be noise inside the box. A stop at 331 against an upside look at 415 is about 60 dollars of room up and about 20 dollars of risk down. That is a risk-reward choice, not a new thesis.
Netflix can wait for a pattern, not a fast rally
NFLX is still a stock to build, not a stock that has to be bought. Cap the position at 4%. It is drifting toward the lower end of the range, and the decline has been heavy, but the last bounce never gave a proper stabilization pattern. The September 18 gap looked like a new low, not an entry.
A buy needs a pattern that actually proves the entry. After that entry, do not expect a fast rally. There was a large top overhead, a positive headline that failed to hold, and a later slide that traded like bad news. The technicals are small swings. On the fundamentals, next year's EPS growth is single-digit. This is not a trading hotspot. A position at this price needs more than a year before the payoff is the base case. It has only just reached the lower bound of the forward valuation.
Three paths
Bullish: the 10-year falls clearly back below 5%, utilities outperform, and bond shorts cover. Growth would benefit too, because the discount rate came down, not because earnings suddenly improved.
Neutral: yields keep grinding at a high level, NVDA holds the new-high structure under 236, and AMD does not close below 599.24. The buyback props up a grind. It does not shrink a Nasdaq futures net long that is already crowded.
Bearish: the 10-year keeps rising, AMD closes through 599.24, and the repair target is below 562. If utilities are still falling, do not treat that as fresh evidence that the business suddenly broke. The short was already extreme.