Amazon and Intel Extend the Tech Selloff. Can Friday Hold?

US Stocks · Options · News · Views
The indexes fall, but breadth improves
Mega-cap technology stocks remain under pressure, while most stocks are telling a different story. On Thursday, the Nasdaq Composite fell 1.38% and the S&P 500 lost 0.30%, while small-cap ETF IWM rose 0.97%. Among S&P 500 constituent securities, 406 advanced and 97 declined. Technology and communication services were the only two of the eleven sectors to fall. A few heavyweight stocks dragged down the indexes even as most securities rose.
That divergence leaves open a more constructive path. If cyclical stocks and other sectors keep attracting money while technology corrects, the market's advance could broaden. One day of rotation is not enough, though, and losses in the heavyweights can still push the indexes lower. Watch both whether technology stabilizes and whether the number of advancing stocks holds up. A single down day in the Nasdaq does not describe the whole market.
The pressure intensified after Thursday's close. Earnings from INTC and AMZN delivered successive blows to technology sentiment. Friday's closes in SOXX and QQQ will offer a more useful signal than one sharp overnight drop.
Intel's better quarter meets weak guidance
INTC reported third-quarter revenue of $16.513 billion, up 21% from a year earlier. Its non-GAAP gross margin was 44.1%, operating margin was 19.6%, and earnings per share were $0.52, above the $0.40 consensus. On a GAAP basis, gross margin was 43.0%, operating margin was 15.3%, and EPS was $0.60. Keep the two accounting bases separate when making comparisons.
The businesses also diverged. Client computing revenue was about $8.1 billion, down 5%, while data center and A.I. revenue reached about $7.3 billion, up 78%. Foundry revenue was about $6.7 billion, up 58%. Its operating loss narrowed from about $2.321 billion to $1.853 billion. Foundry revenue includes internal transactions that are eliminated in consolidation.
Fourth-quarter guidance is the bigger problem for the stock. Revenue is expected to be $15 billion to $16 billion. The $15.5 billion midpoint is below consensus of about $17.07 billion. Non-GAAP EPS guidance of just $0.25 also missed the $0.43 expectation. Weak PC demand, memory costs, and inventory adjustments remain disruptive. For now, strong data-center growth cannot offset the shortfall in the coming quarter.
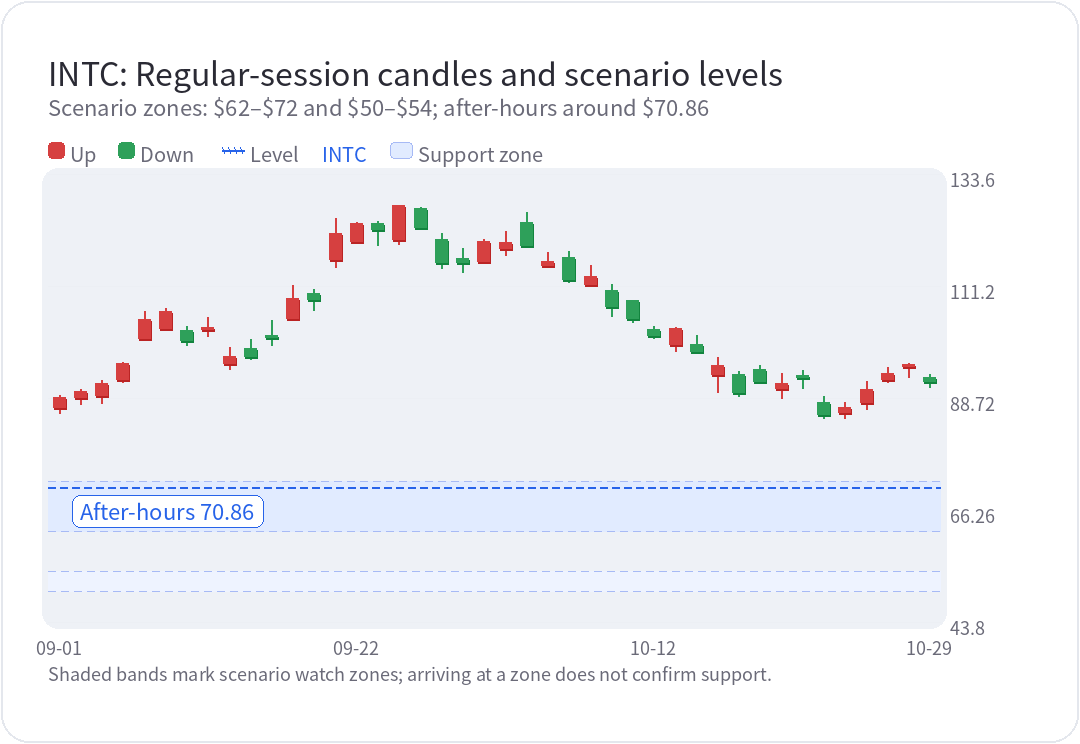
The stock closed regular trading at $92.07 and finished the standard after-hours session around $70.86. Even after that plunge, the valuation still depends on what Intel can earn next. The $62 to $72 range can serve as the first scenario zone to monitor, with $50 to $54 next if that range fails. These are valuation and trading assumptions, not proven price support. Until the PC outlook and next-quarter guidance improve, manage exposure as a swing trade. A trade in the rebound needs an exit condition before entry.
Amazon: strong cloud growth, weaker retail and advertising
AMZN reported third-quarter net sales of about $201.9 billion, up 12%, or 13% excluding currency effects. That was slightly below expectations of about $202.3 billion. Prime Day moved from last year's third quarter to this year's second quarter. The company estimates that the timing change reduced growth by about four percentage points. Do not attribute that entire timing effect to deteriorating consumer demand.
Net income was about $20.7 billion, with EPS of $1.89 versus expectations of about $1.96. The year-over-year comparison needs to account for roughly $9.5 billion of pretax investment gains in the prior-year quarter. This quarter had no equivalent contribution of that scale, so the profit comparison does not directly measure underlying operating performance.
AWS revenue was about $46 billion, up 39.3%. Annualizing the quarter gives a run rate of about $184 billion, and cloud demand remains strong. Advertising revenue was about $19.64 billion, up roughly 11%, below expectations of about $20.8 billion. A shift in advertising budgets to the fourth quarter is one possible explanation, but next quarter's revenue still needs to validate it.
Cash burn increases the funding burden
AMZN is putting capital to work faster than the cash is coming back. Cash purchases of property and equipment reached about $77.3 billion in the third quarter, up from about $54.2 billion in the second. The full-year capital-spending plan of about $220 billion was not raised, but the cash pressure remains substantial.
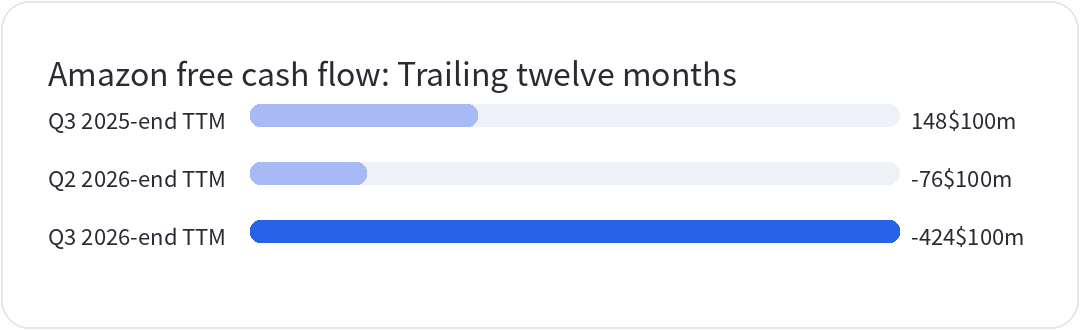
Trailing twelve-month free cash flow was negative $42.4 billion at the end of the third quarter, versus negative $7.6 billion at the end of the second quarter and positive $14.8 billion a year earlier. All three figures cover rolling twelve-month periods. Using the same formula of operating cash flow less cash property and equipment purchases, plus proceeds from disposals and incentives, third-quarter free cash flow alone was about negative $33.456 billion.
Cash proceeds from long-term borrowing totaled about $115.1 billion in the first three quarters, including about $48.1 billion in the third quarter. The carrying value of noncurrent long-term debt rose from about $65.6 billion at the end of last year to about $173.1 billion. Third-quarter interest expense was about $1.7 billion, versus about $0.5 billion a year earlier. The $115.1 billion figure measures financing cash inflows; $173.1 billion measures the debt balance at the reporting date. Repayments, reclassifications and other adjustments also affect the difference.
The larger the investment, the greater the pressure to generate cash returns. AWS growth can support long-term investment, but the scale of the buildout makes depreciation, financing costs, and cash conversion increasingly relevant to shareholder returns. The after-hours selloff lowers the entry price. It does not automatically resolve those pressures. A credible long-term buying opportunity depends on sustained cloud growth, narrowing cash burn, and the indexes holding their watch zones on Friday.
Microsoft debt: assess cash generation and funding costs
MSFT has priced $25 billion of bonds in ten tranches, with maturities ranging from two to forty years. Settlement is expected on November 4. A long-term bond issue alone is insufficient evidence of a cash crisis. Operating cash flow, capital spending, and debt maturities all need to be assessed.
In the first quarter of fiscal 2027, Microsoft generated about $58 billion of operating cash flow, spent about $39.4 billion on cash purchases of property and equipment, and produced about $18.6 billion of free cash flow. Management expects free cash flow to remain positive for the full fiscal year. That is a forward-looking expectation, subject to future operating results and spending. Positive free cash flow at the group level does not show that every A.I. project has earned back its investment. It also does not establish coverage of every use of cash, including dividends and buybacks. Debt issuance can lock in funding and extend maturities. Whether it is attractive depends on the actual coupons, terms, and future returns.
The offering attracted about $115 billion of orders, or 4.6 times the deal size, showing strong investor demand. The deal size remains $25 billion. MSFT carries AAA from S&P and Aaa from Moody's, which supports its access to funding. Those ratings assess debt repayment capacity; the stock price can still fluctuate.
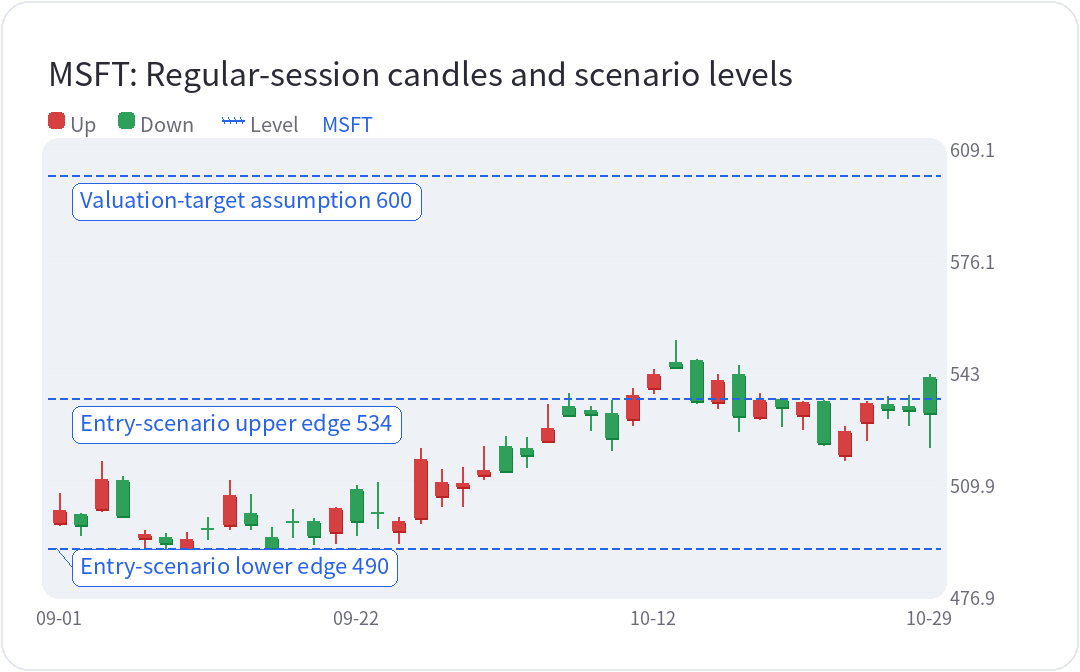
The $490 to $534 range remains a scenario zone for considering gradual long-term entries. Above $600 is a valuation-target assumption. Earnings and cash flow still need to validate those levels. One debt offering cannot establish a loss of cash-generating ability, and strong bond demand cannot remove the risk around returns on capital spending.
Friday's close is the test
SOXX is a semiconductor ETF. It closed Thursday's regular session at $513.86 and finished the standard after-hours session around $490.47. The $482.80 level is close to Monday, October 26's opening price of $482.84. It can help test whether the starting point of this rebound remains intact. It was not Monday's low.
QQQ closed regular trading at $715.34 and finished standard after-hours trading around $704.31. The $696 to $698 range is the next scenario zone to monitor, and Friday's close still needs to validate it. The case for easing selling pressure and a recovery requires QQQ to hold that area at Friday's close and SOXX to hold around $482.80. A closing break below those areas would weaken the near-term outlook. A cheaper long-term valuation cannot replace risk control.
Some weekly and month-end options expire on Friday. Closing positions after expiration could ease selling pressure, but a V-shaped recovery still needs confirmation from price and volume. It is too early to assume that options flows will pull the market back up. If support holds without a rebound, bulls and bears are still digesting earnings and further confirmation is needed.
The next political calendar event is the midterm election vote on Tuesday, November 3. Results may become clear that evening, the following day, or later. Positions with existing downside protection can use Friday's close as a review point. For capital still on the sidelines, first see whether the watch zones hold, then decide how much volatility to accept.