Spending is still rising. The growth rate already peaked.

US Stocks · Options · News · Views
Four indexes, four ways to fall
All four major indexes finished slightly lower on Tuesday, and they did not fall the same way. The Dow and the Russell opened higher and then gave it back. The S&P 500 was whipped around and still closed a fraction lower. The Nasdaq gapped down, recovered most of the loss, dipped once more, and then sat in a narrow range. The Dow closed at 51,670.10, down 0.35%. The S&P 500 closed at 7,805.37, down 0.02%. The Nasdaq composite closed at 27,204.38, down 0.15%.
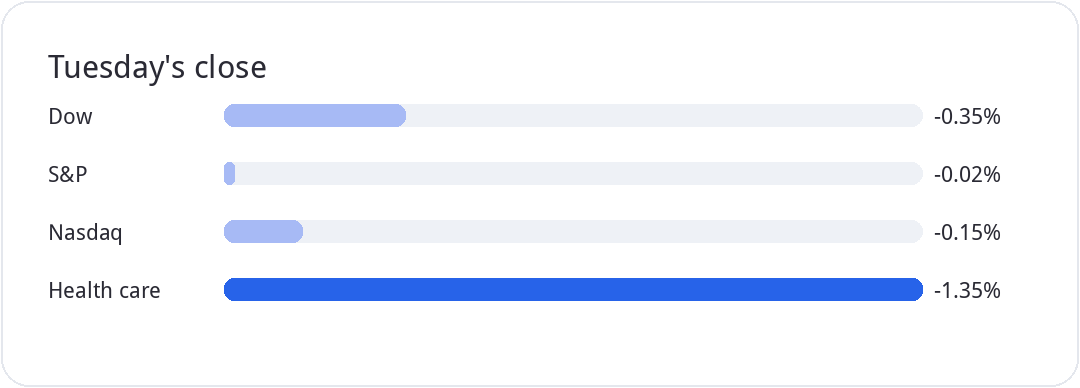
Semiconductors were better than Monday. The Philadelphia semiconductor index opened weak and climbed back. Twenty members rose and ten fell. Memory was still the soft pocket inside that group. Health care was the worst of the eleven S&P sectors, down 1.35%, with Johnson & Johnson's report sitting on the group. There was no macro print. Fed speeches can wait. The session was bank earnings, and one chart of capital-spending growth.
UnitedHealth is already priced near the middle
UNH earned 4.69 dollars a share on an adjusted basis in the third quarter, above the 4.14 dollars expected. Revenue was 112.7 billion, above 111.31 billion. Full-year adjusted earnings are now guided to at least 20.50 dollars a share. The prior range was 19.50 to 20.00. That is a fifty-cent raise at the top, and the third time this year the outlook has moved up.
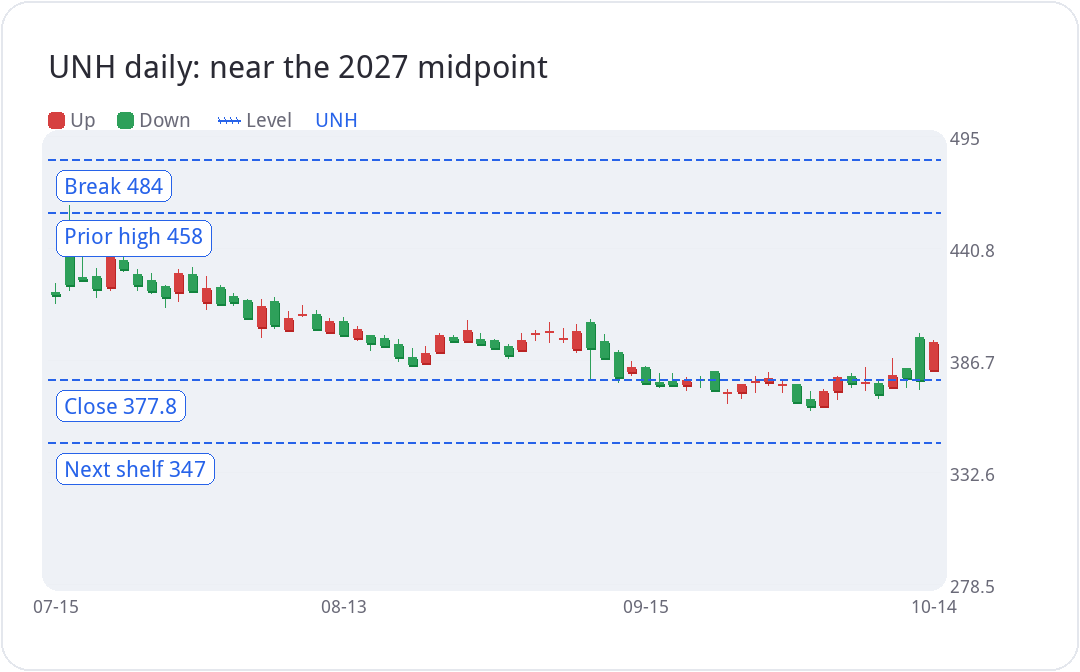
The stock opened high and closed weak. It finished at 377.76, down 0.20%. A lot of financials did the same thing, including JPMorgan and Goldman. The 2026 forward range is about 276 to 444, with a midpoint of 360. The price is already above this year's midpoint. The year that matters is 2027: 301 to 499, midpoint 405. The stock is sitting on that midpoint. The business is not expensive. Technically, a new leg needs a break of 484. The prior high at 458 rejected it once. After the pullback it is back in the 361 to 484 range. The next shelf down is 347 to 357. Operations are still lifting earnings. Last year's headwind has turned. A long-term holder needs patience. 458 does not look like the high of this run.
JPMorgan missed twice, and it is not a must-own
JPM rarely misses both lines. Adjusted revenue was 50.91 billion, up 8% from a year ago, below 51.37 billion expected. Adjusted earnings were 5.75 dollars a share, below 5.93. Fixed income, currencies, and commodities revenue was 5.37 billion, against 6.0 billion expected. That is the trading book, and the bond book was the weak part, including a one-time loss. Equities sales and trading were 4.95 billion, above 4.47 billion. Investment-banking revenue was 3.0 billion, up 15%, below 3.27 billion. Advisory was 1.22 billion, up 32%, above 1.14 billion. Equity underwriting was 564 million, below 646 million. Debt underwriting was 1.22 billion, below 1.24 billion. Selling bonds was soft too. Net interest income was 27.15 billion, up 13%, a bit above 26.87 billion. The provision for credit losses was 2.74 billion, down 19%, below 2.79 billion expected. Provisions are not being built. The book is not pricing a larger credit problem yet.
Full-year net interest income is now expected at 106.2 billion, versus about 105.5 billion in the July view. Next year's core net interest income, excluding markets, is about 107 billion. Both figures are roughly a billion above analysts. The stock fell, then recovered after the outlook and the call, and still did not finish well. It closed at 331.43, down 0.86%.
The 2026 forward range is about 271 to 408, midpoint 348. For 2027 it is about 269 to 423, midpoint 346. The price sits near the 2027 midpoint. Next year's earnings growth is roughly between plus 1% and minus 1%. The swing factors are whether net interest can rise further, and whether a large Anthropic listing shows up this year or an OpenAI listing next year. Those would help underwriting. Everything else follows the financial backdrop. Net interest is about a billion ahead this year and next. That is not a headwind, and it is not a strong tailwind either. The only nearby ceiling is 345 to 360. Down at 289 to 318 the forward value gets near the low end. At 276 to 285 there is more room. To own it for the space, it has to fall further. At this price it is optional.
Goldman was not fully worked through. What is clear is that the price is already well above the midpoint and near the high end. Above 1,000 it was already rich, because the market had prepaid the underwriting from the SpaceX listing. Investment banking did grow. It did not grow as much as expected. The stock also finished roughly flat. Resistance is 998 to 1,074, with a strong shelf near the current price. A Goldman trade is an investment-banking trade. That business is busy when large listings and deals are busy. Few companies want to list in a bear market.
The growth rate peaked. The dollars did not.
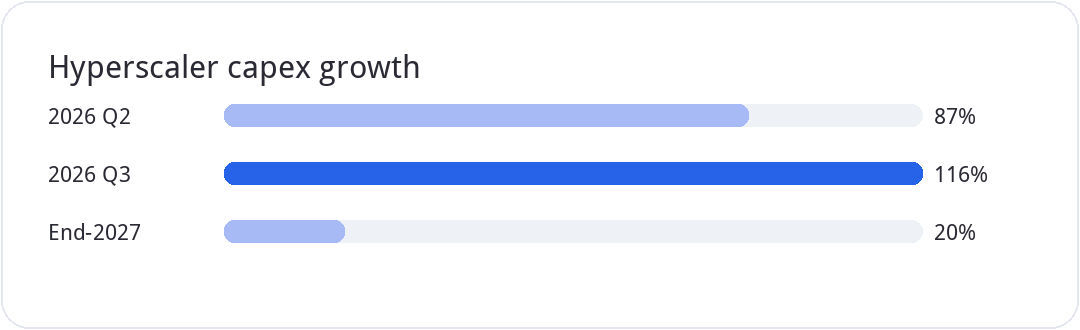
The FactSet and Goldman consensus chart is year-over-year growth, not the level of spending. Second-quarter 2026 growth was about 87%. The quarter just ended was about 116%. That is the peak in the growth rate. The bars after it are still positive. Spending is still rising. It is rising more slowly. By the end of 2027 the growth rate is about 20%. Twenty percent is still growth. It is not a decline.
The money leaves Microsoft, Google, Amazon, and Meta, plus Oracle and SpaceX, and it lands first with the shovel sellers: Nvidia, AMD, Broadcom, optical modules, and memory. The shovels go into the data halls. They only become revenue when enterprises buy the output. Consumer use is a small share. Slower growth can mean demand for compute is no longer keeping up with the buildout. It can also mean the spenders want to earn something back before they add more. Margins at the shovel companies get hit first. Operating margins follow. The steep part of semiconductor earnings growth bends down with that curve.
A data point that says growth has peaked, and a slogan that says demand has no ceiling, are not the same claim. Demand can still be there while the profit is not. If the supply chain is no longer in a scramble, earnings growth at the chip companies slows first. These bars are still consensus, not the third-quarter filings. The real numbers arrive at the end of October at the earliest, and with the fourth-quarter reports next January at the latest. If the later bars stay near 100%, or still show 50% to 60% at the end of 2027, this chart is not a warning. Growth is still here. It will not stay on the steepest slope forever.
SOXX and SMH are still in an up structure
The Philadelphia semiconductor index cleared 577 a few days ago. Clearing it meant a path toward new highs in a spiral, not a straight line. It is back under 550, inside the 486 to 577 range. It has not broken down. The structure is still pullback, stabilize, then another push. The view changes only under 486. That is when looking up becomes looking for a low. Tuesday opened about three points lower, traded down toward 527, and closed with only about a 0.17% decline. For a swing, the closer price gets to 486, the smaller the stop and the larger the room back to the old high. That only works with a stop. Without a stop, it is not a swing.
SMH is similar. 586 broke today. It opened at 574 and closed at 588, and the break still counts. A confirmed breakdown needs a loss of 534. Then the posture is defense. The two funds do not hold the same weights, so some days this year they diverge. Over ten years the correlation is about 0.96 to 0.98, and the return gap is about 1%. For a long holding, either one is fine. For a short trade, take the cleaner chart. Both still have supply overhead and support underneath. Until the support breaks, the structure still points up. After it breaks, stop using the up structure.
ASML reports tomorrow. That print, not Tuesday's open-and-recover, decides whether semiconductors get a lift or a shove.
The indexes are high. Many stocks are not.
Year to date, three of the four major indexes are up by double digits. The Dow is the exception. Nine of the eleven S&P sectors are up. Only consumer discretionary and communication services are not. Nearly two-thirds of S&P members are higher. One hundred and twenty-three are up 25% or more. Forty-two are down 25% or more. Fifty-three are up 50% or more. Eight are down 50% or more. The median stock trades about 15% below its 52-week high. That is the widest gap of this kind since the internet bubble, and the index does not show it. A concentrated mistake hurts the account more than a fractional decline in the index. This year is hard because stock-picking and holding are hard, not because the indexes failed to rise.